Quantifying Fear and Greed in Crypto Markets with All Star Charts
I spent some time chatting with All Star Charts founder, JC Parets, on Tuesday, August 24th. We focused on data that JC relates to Bitcoin sentiment or the mood of the market. You can watch the video here.
Market sentiment is difficult to measure, because it is impossible to directly observe and so we must use proxies. That said, JC loves the on-chain analytics blockchain affords as it gives him data he is unable to access in equity markets.
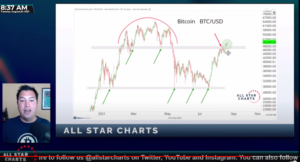
JC applied 3 indicators in conjunction to make sense of Bitcoin sentiment, including Price, Average Coin Dormancy, and Exchange Balances.
Overall, he observes mixed signals and is looking to price to confirm bullish dormancy and exchange balance data.
The most interesting data set JC shared is a 44 month chart of Average Coin Dormancy. Dormancy reflects the age of the coins that are being moved. When Dormancy is high, it means that coins being spent have been held for a long time and are being put back into circulation.
When dormancy is low it means that older coins are not being spent. In other words, hodlers are hodling.
JC’s chart, shared below, shows dormancy and price.
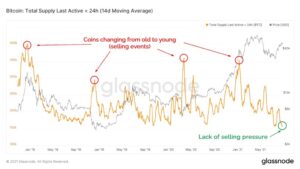
Even as Bitcoin has rallied from the July bottom, dormancy remains low. So hodlers are hodling.
Glassnode has an excellent primer on Average Coin Dormancy for those interested in learning more about this data.