What Happens After Bubbles Pop?

Hot Air Ballon photo via Pixabay on pexels.com
Success is how high you bounce back after you hit bottom.
– General George Patton
As long as people are involved in markets, we’ll get bubbles and crashes.
It’s glorious and horrible and a reflection of the emotional rollercoaster we ride when we put on risk. We’ve seen it over and over again throughout history. Which brings us to the question of the day.
What happens to asset prices after bubbles pop and what might this tell us about future prices?
There are three possible scenarios…
Scenario One: Sometimes, Prices Never Come Back
If you got long tulip bulbs during the second half of 1636 near the peak of Tulip Mania, we’re sorry to report, but you (your descendents really) are still waiting to break even and it’s not looking good.
At the height of this historic bubble, a buyer paid eight fat swine for one tulip bulb. Today, you can buy them online for $2 a bulb.\

It’s been 400 years. In this case, the asset was never worth prices paid at the highs. The price behavior and the mania can be chalked up to human irrationality in its purest and most spectacular form.
A more recent instance might be the Nikkei 225. The index peaked in early 1989 near 39,000 and has not yet surpassed that high. It’s been 31 years in the desert, though recently, it has rallied a lot and only has another 23% to go.
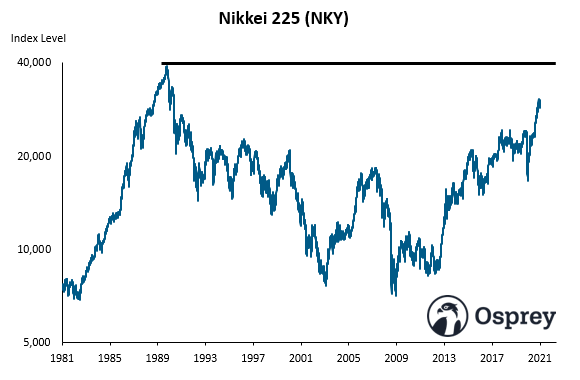
We’re patient and so we’ll put the Nikkei in the too soon to tell camp. It could be a Scenario Two.
Scenario Two: Price Comes Back, Eventually
Sometimes, price recovers after a bubble pops but does so only slowly over a long period of time.
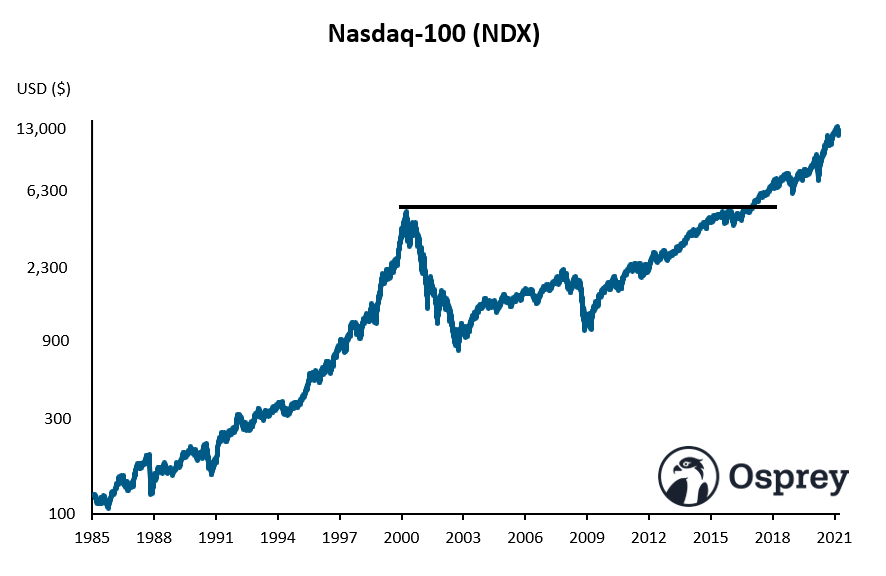
Let’s take the Nasdaq 100 Index after the internet bubble.
In March of 2000, the index closed near 4,700 after an epic run. Over the next 2.5 years, it fell to a low just below 800. Quite the crash.
It took 15+ years for the NDX to make a new all-time high above the March 2000 high. It came back, eventually.
Scenario Three: Prices Make New Highs in Short Order
Occasionally, an asset crashes hard after a huge run but then makes new highs sooner than later.
This kind of action exemplifies price resilience.
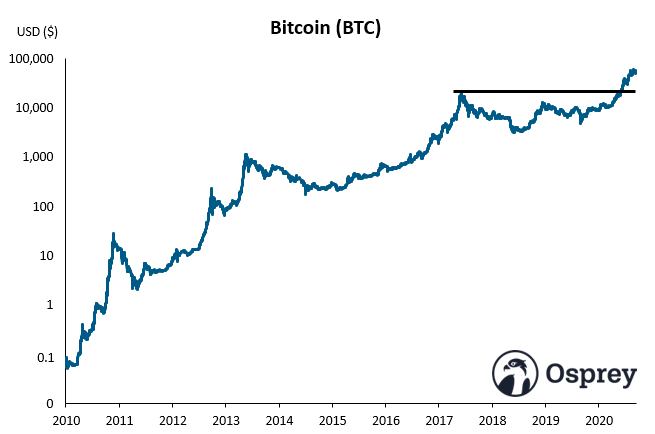
In 2017, bitcoin rose from $600 to $19,000 from January to December. Quite the year. Then, it fell 85% to $3,200 in 2018.
By December 2020, bitcoin reclaimed the December 2017 high and has since tripled.
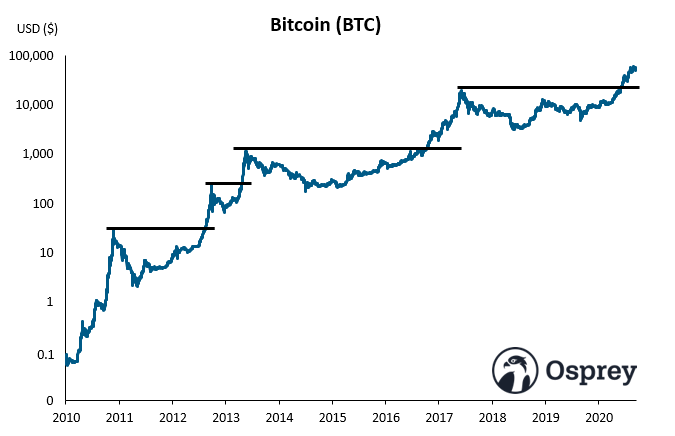
One more thing
The parabolic move during 2017 and subsequent price correction was not the first or even second time bitcoin made new highs after a precipitous fall. It was only the most well-known.
In its brief history, bitcoin exhibited similar price resilience multiple times. Have a look.
It is difficult to quantify the fundamentals and emotions surrounding any asset, but we can directly observe price behavior.
Phil Pearlman is the Chief Behavioral Officer at Osprey Funds.
This information should not be relied upon as investment advice, or a recommendation regarding any products, strategies, or any investment in particular. This information is strictly for illustrative, educational, or informational purposes and is subject to change. The author of this article owns bitcoin, directly and through the Osprey Bitcoin Trust.
Index Price Data Sources: Bloomberg
Bitcoin Price Data Sources: Coinmetrics